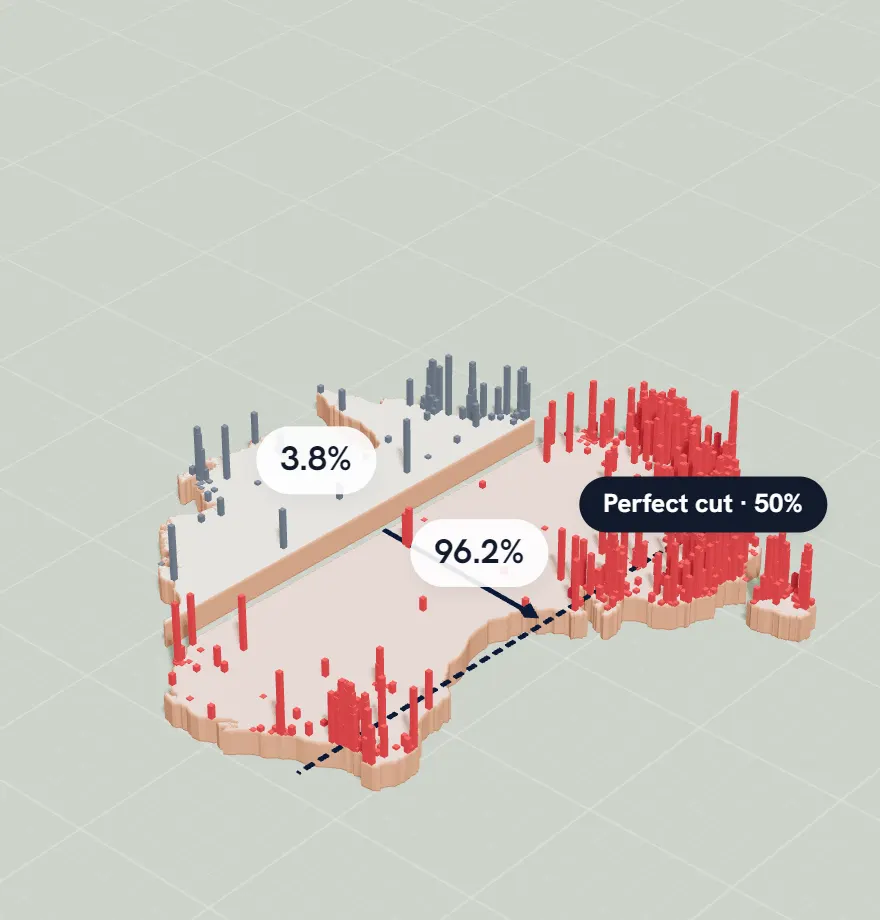
The south-east side: half the population, on 2.7% of the land
The rest: the other half, on 97.3%
Taller columns mean more people. The dashed line is the most lopsided straight cut that still splits the population exactly in half. Data: GHSL population grid (European Commission JRC, 2025) inside Natural Earth borders.
The straight-line test
Draw one straight line across Australia so that exactly half the population is on each side. Of all the lines that do it, the most lopsided puts half of everyone on the south-east side, on just 2.7% of the land.
Now cut the land in half instead, at the same angle. That looks like the fair cut, but the south-east half ends up with 88.1% of the people. Both figures are our measurements from the GHSL population grid (European Commission JRC, 2025) inside Natural Earth borders.
That gap between how a country looks and where its people are is exactly what Slice is about.
Why Australia crowds into one corner
More than two in three Australians live in the eight capital cities: 18.75 million of about 27.6 million people in June 2025, according to the Australian Bureau of Statistics. Sydney (5.64 million) and Melbourne (5.44 million) alone hold about four in ten.
Think you can do better? Try splitting Australia yourself.
Now you know where everyone lives, so this should be easy, right? In Slice you get one straight line to cut Australia's population exactly in half, and a second try if you need it. Then the country splits and the population rises in columns, to show how close you got.
Free, no sign-up. Practice never touches your daily score or streak.
How we measured this
Every figure on this page comes from the same data as the game: the GHSL population grid (European Commission JRC, 2025) inside Natural Earth borders, which estimates how many people live in each 1 km square. We draw the country on an equal-area map, so every square kilometre counts the same.
“0.1% of its land” counts the most crowded 1 km squares first, until they hold half the people. It measures how tightly people pack, which is why it comes out much smaller than maps that colour whole cities or counties. The straight-line figures test a cut at every angle, one degree apart.
Sources
Population: Schiavina M., Freire S., Carioli A., MacManus K. (2023), GHS-POP R2023A, European Commission, JRC (2025 estimate, 1 km). CC BY 4.0.